Ontario’s electricity market continues to evolve, but one fundamental relationship shapes how businesses experience electricity costs: the balance between the commodity (formerly HOEP, now OZP) and Global Adjustment (GA). These two components do not operate independently – when one rises, the other falls. Together, they ensure that Ontario collects the total amount needed to pay generators the guaranteed revenues outlined in their contracts.
By looking back over the past fourteen years, we can see clear long-term trends, periods of market shock, and a total system cost that has gradually increased. Then, using what we’ve learned, we can explore several possible scenarios for future rates over the next three years.
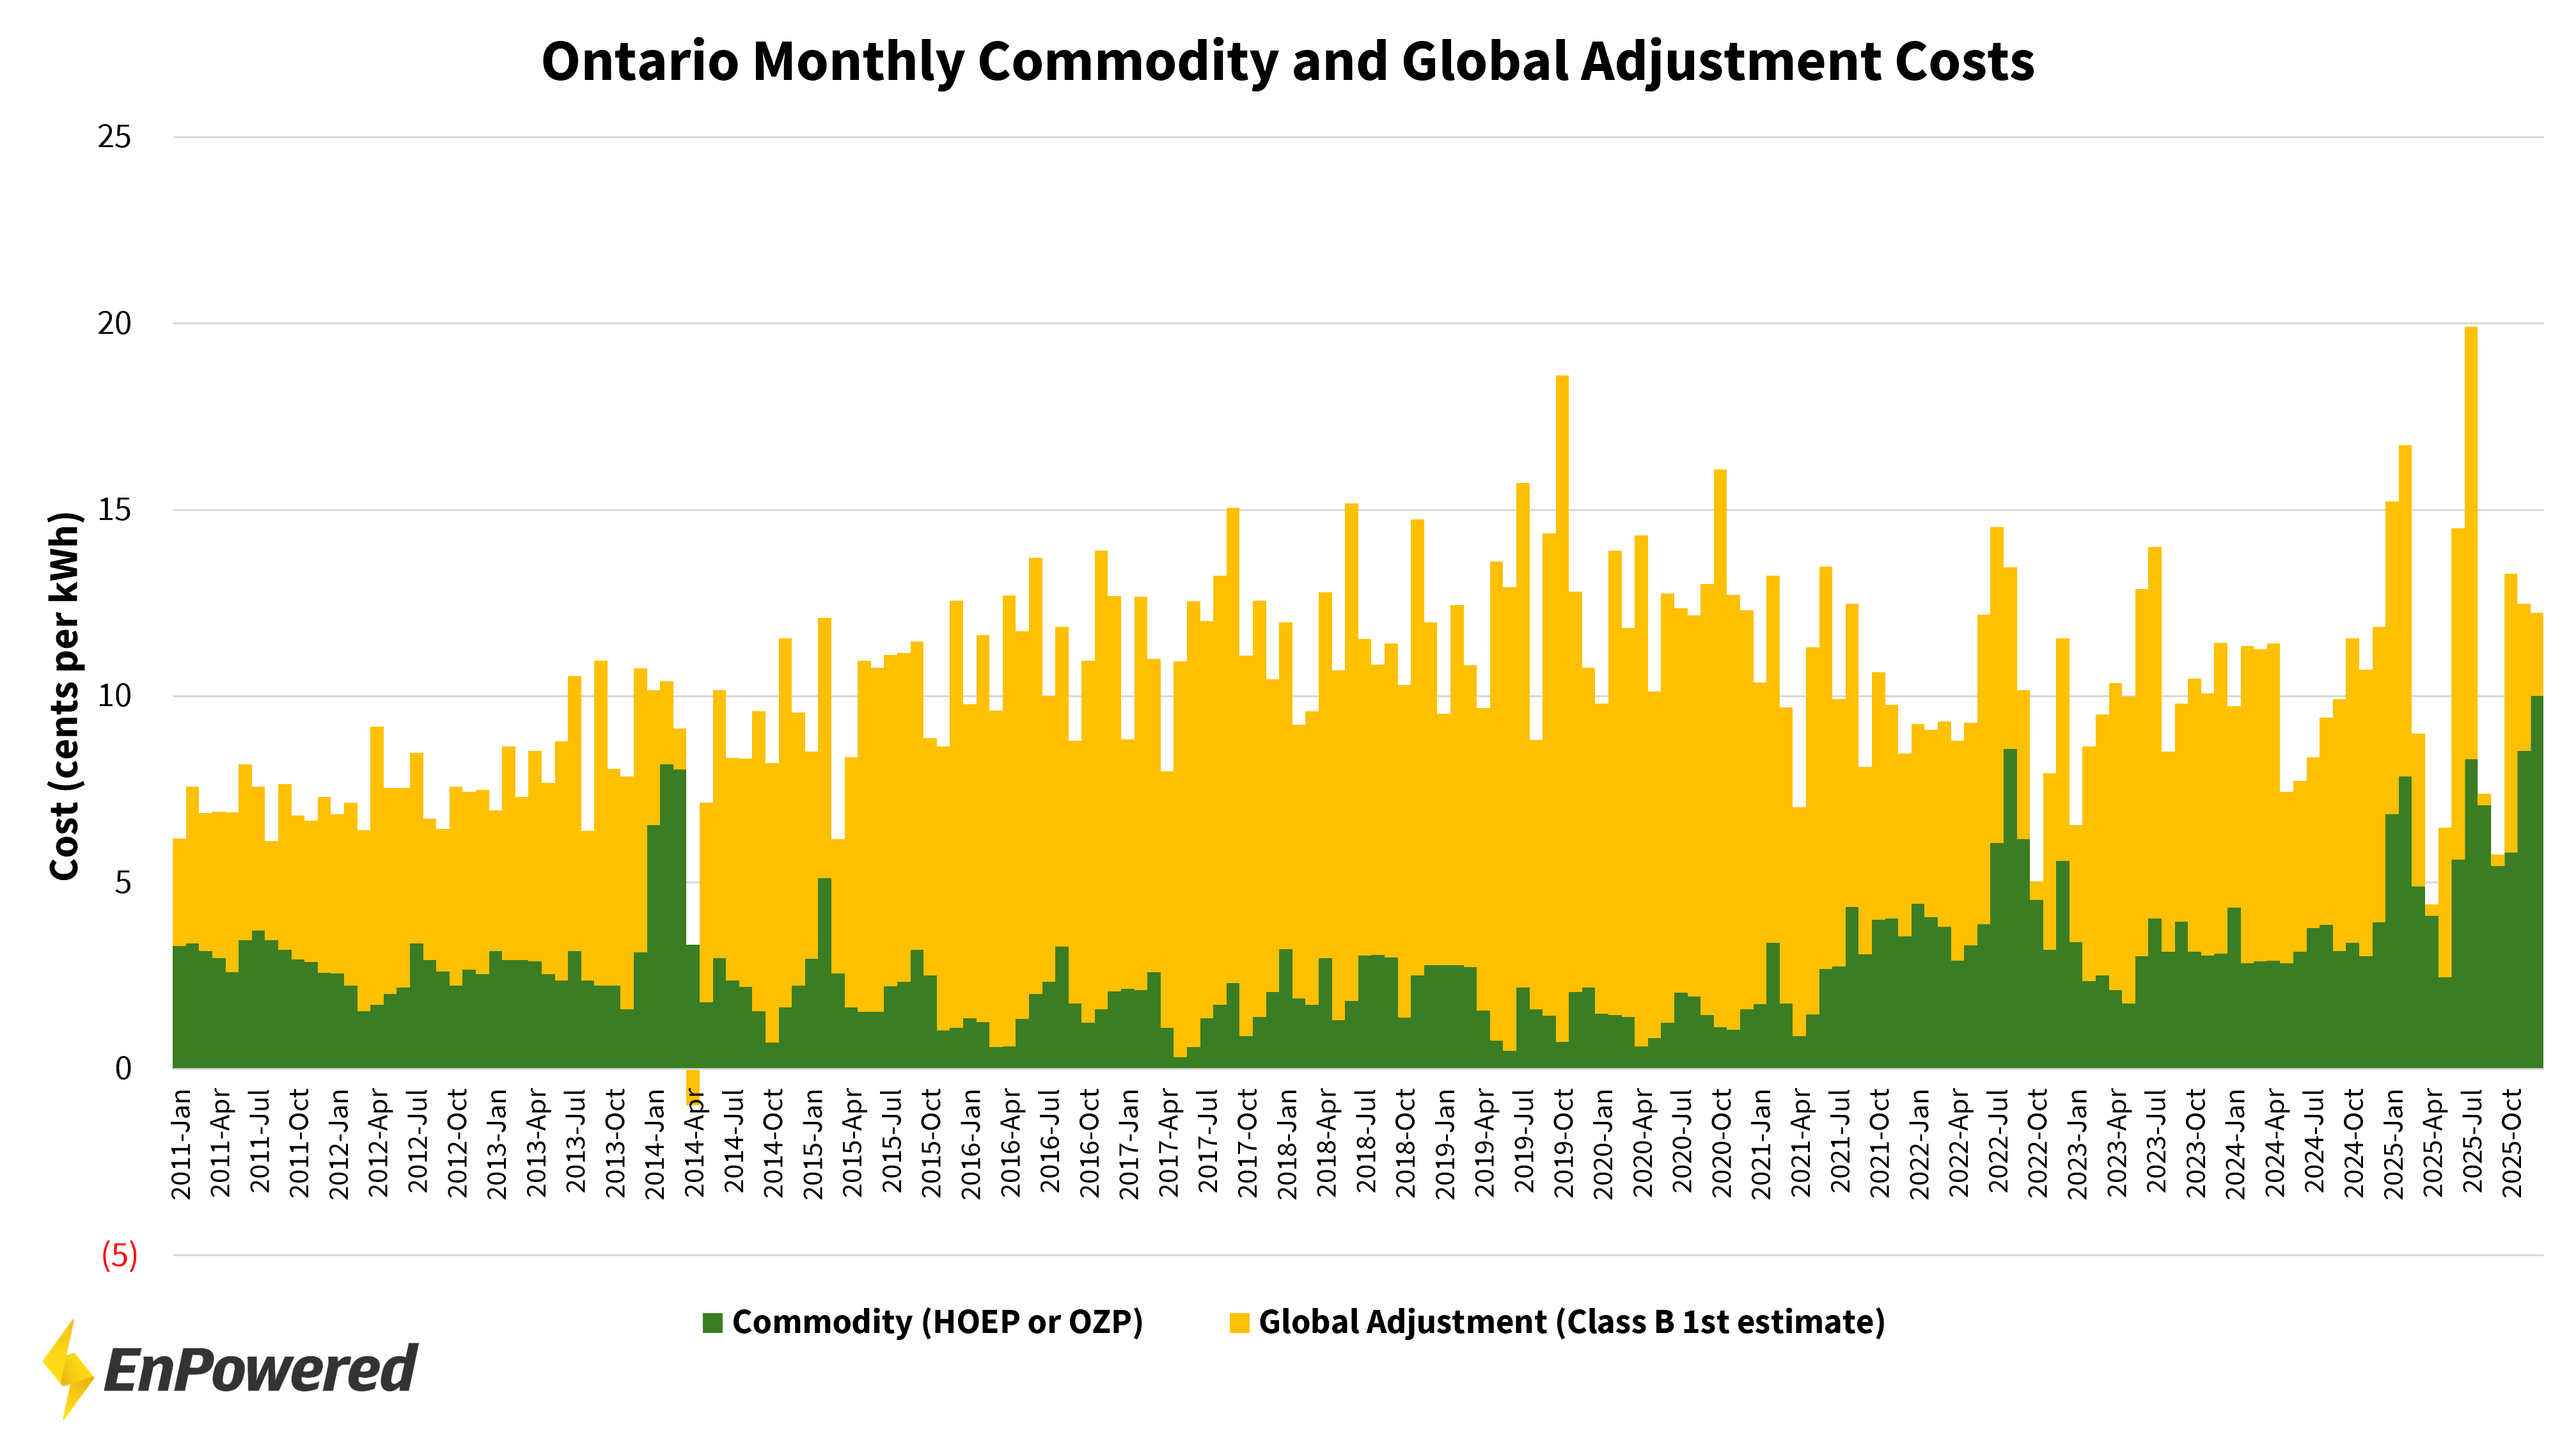
A Noisy Monthly Picture that Reveals a Clear Long-Term Pattern
When we examine commodity (green) and Global Adjustment (yellow) on a monthly basis, the data appears noisy. Monthly variability in natural gas prices, supply availability, contract payments, and system demand leads to wild swings. It can be difficult to see any stable relationship in numbers that move so frequently.
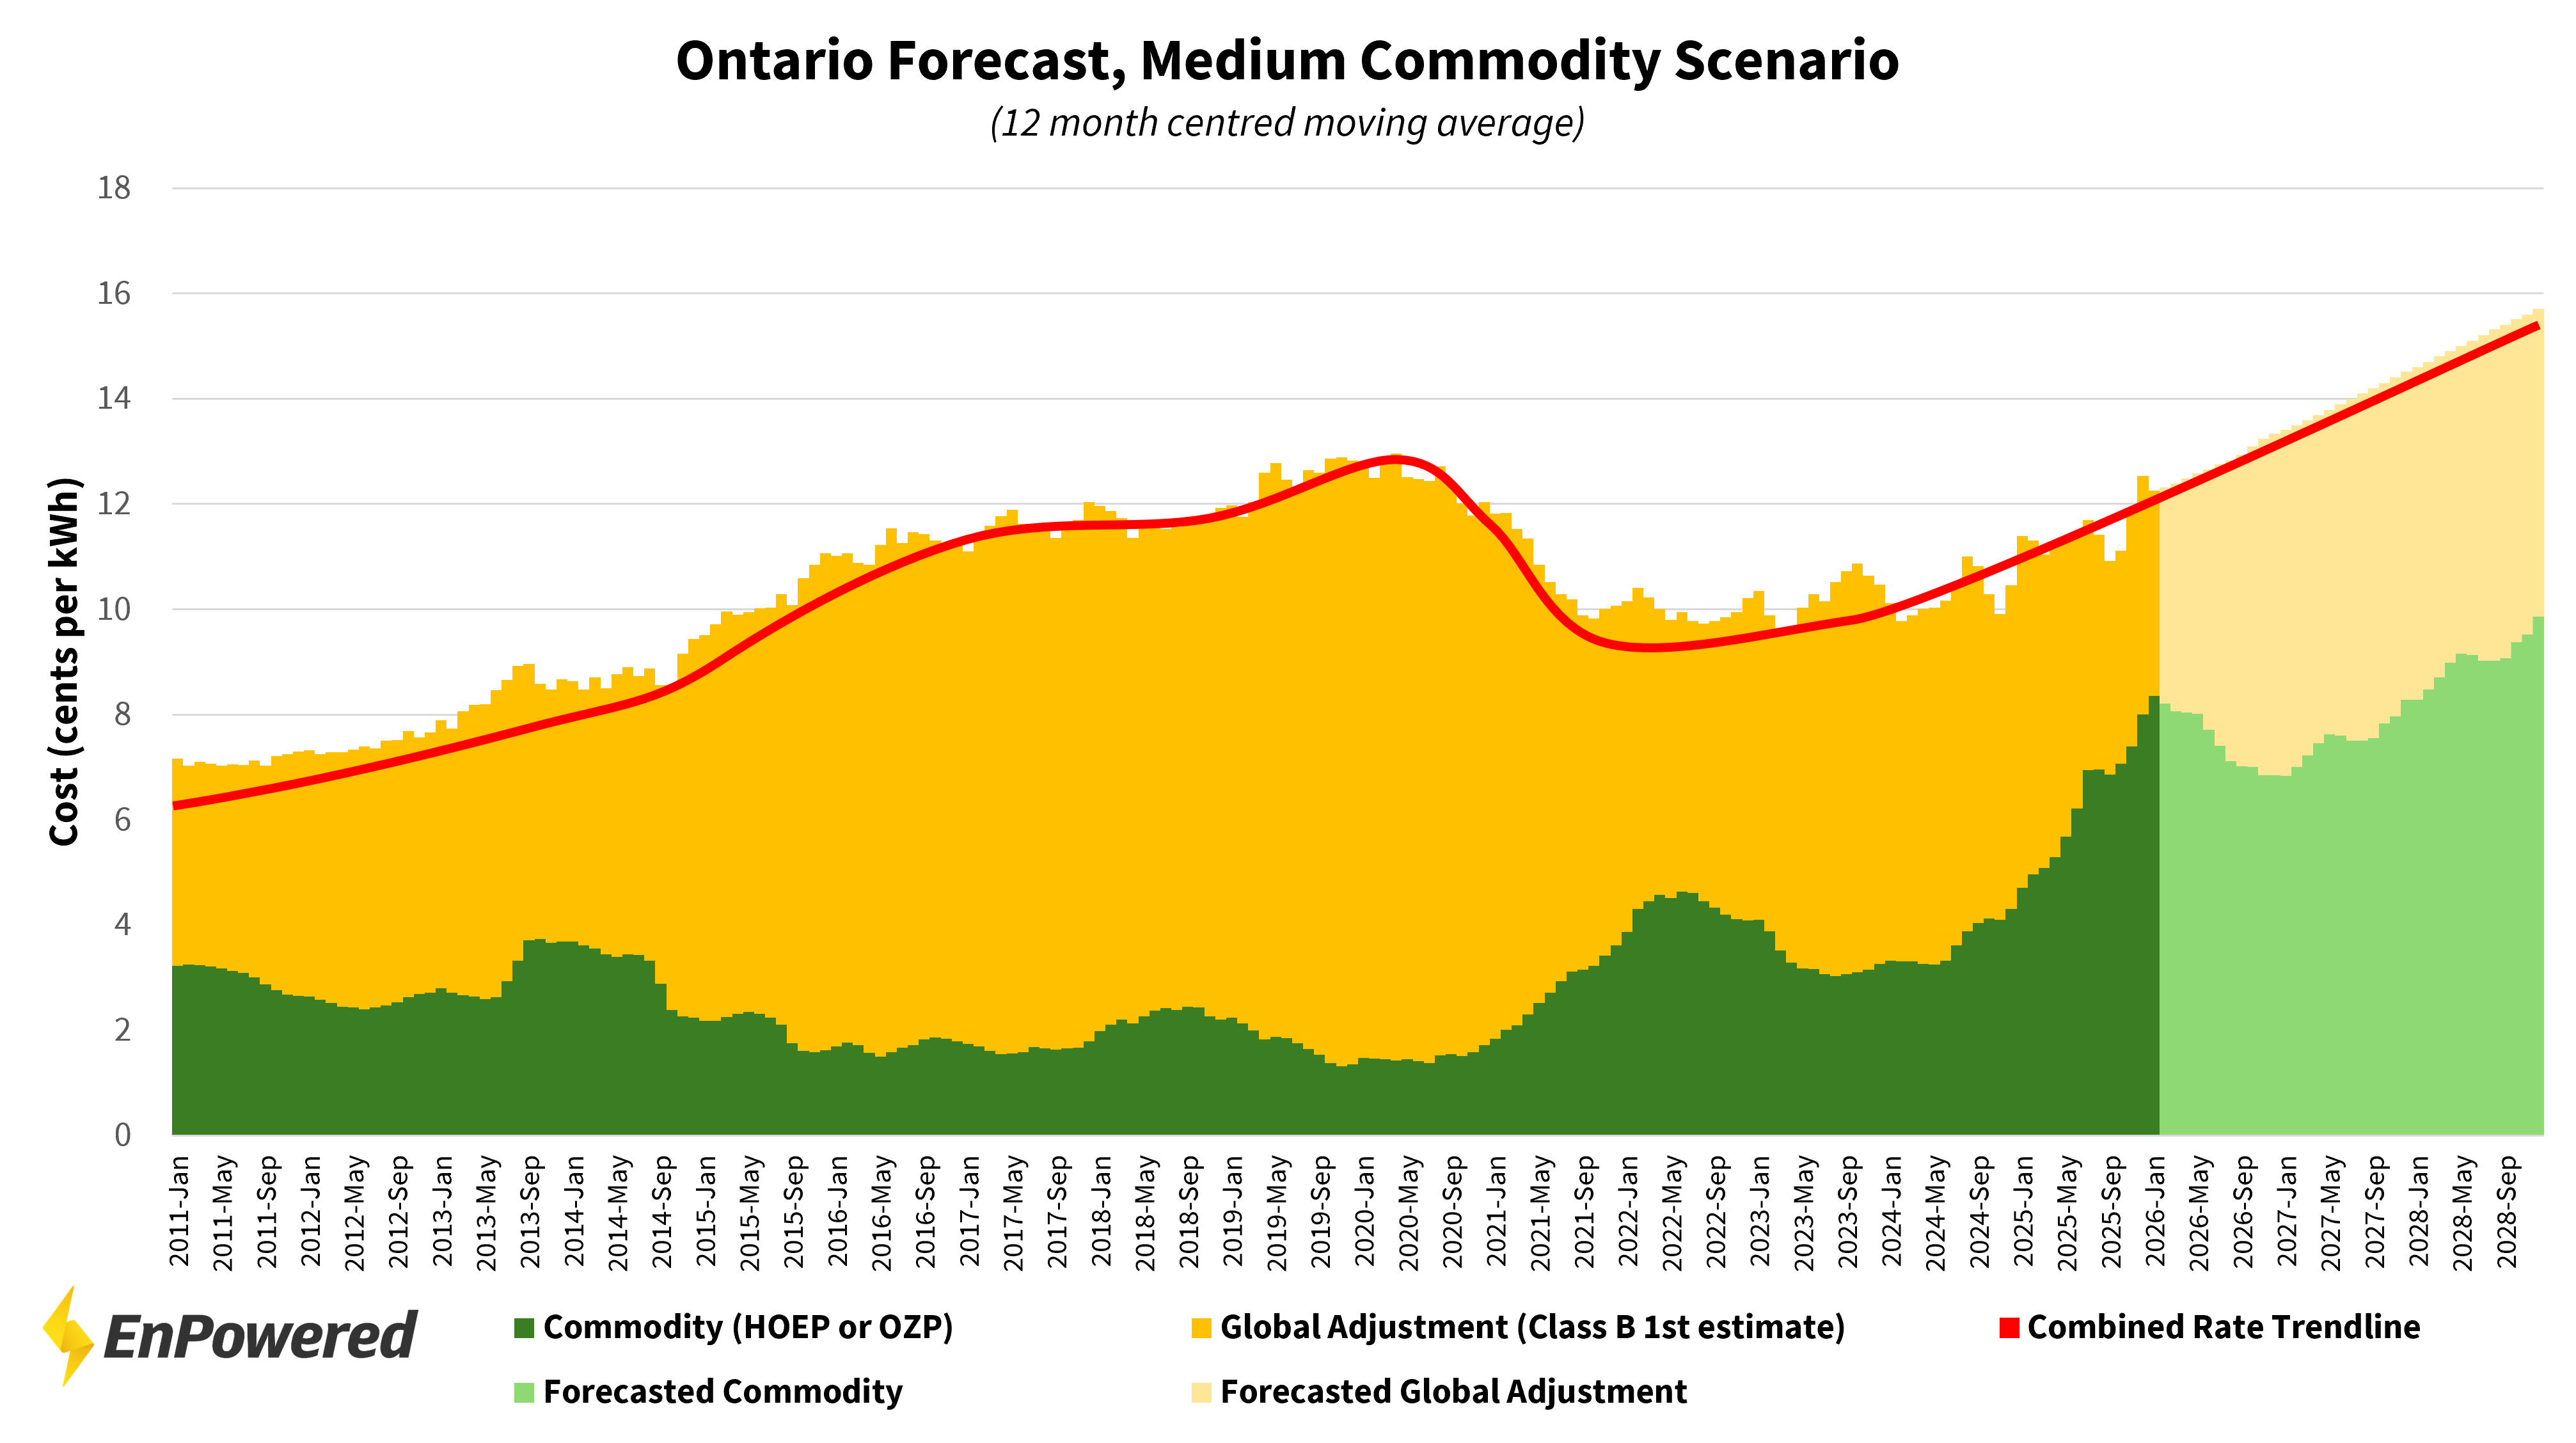
However, when we plot a 12-month centred rolling average, a much clearer pattern emerges. (Note, we used a centred rolling average instead of a trailing average to ensure we accurately reflected the significant increase in commodity rates seen in the last 6 months).
Commodity and GA move in opposite directions because they work together to fill the total revenue requirement of the system. When commodity prices are low, GA rises to ensure generators still receive their contracted amounts. When commodity prices rise – typically because natural gas sets a higher marginal price – GA falls because the market is already providing more of the required revenue.
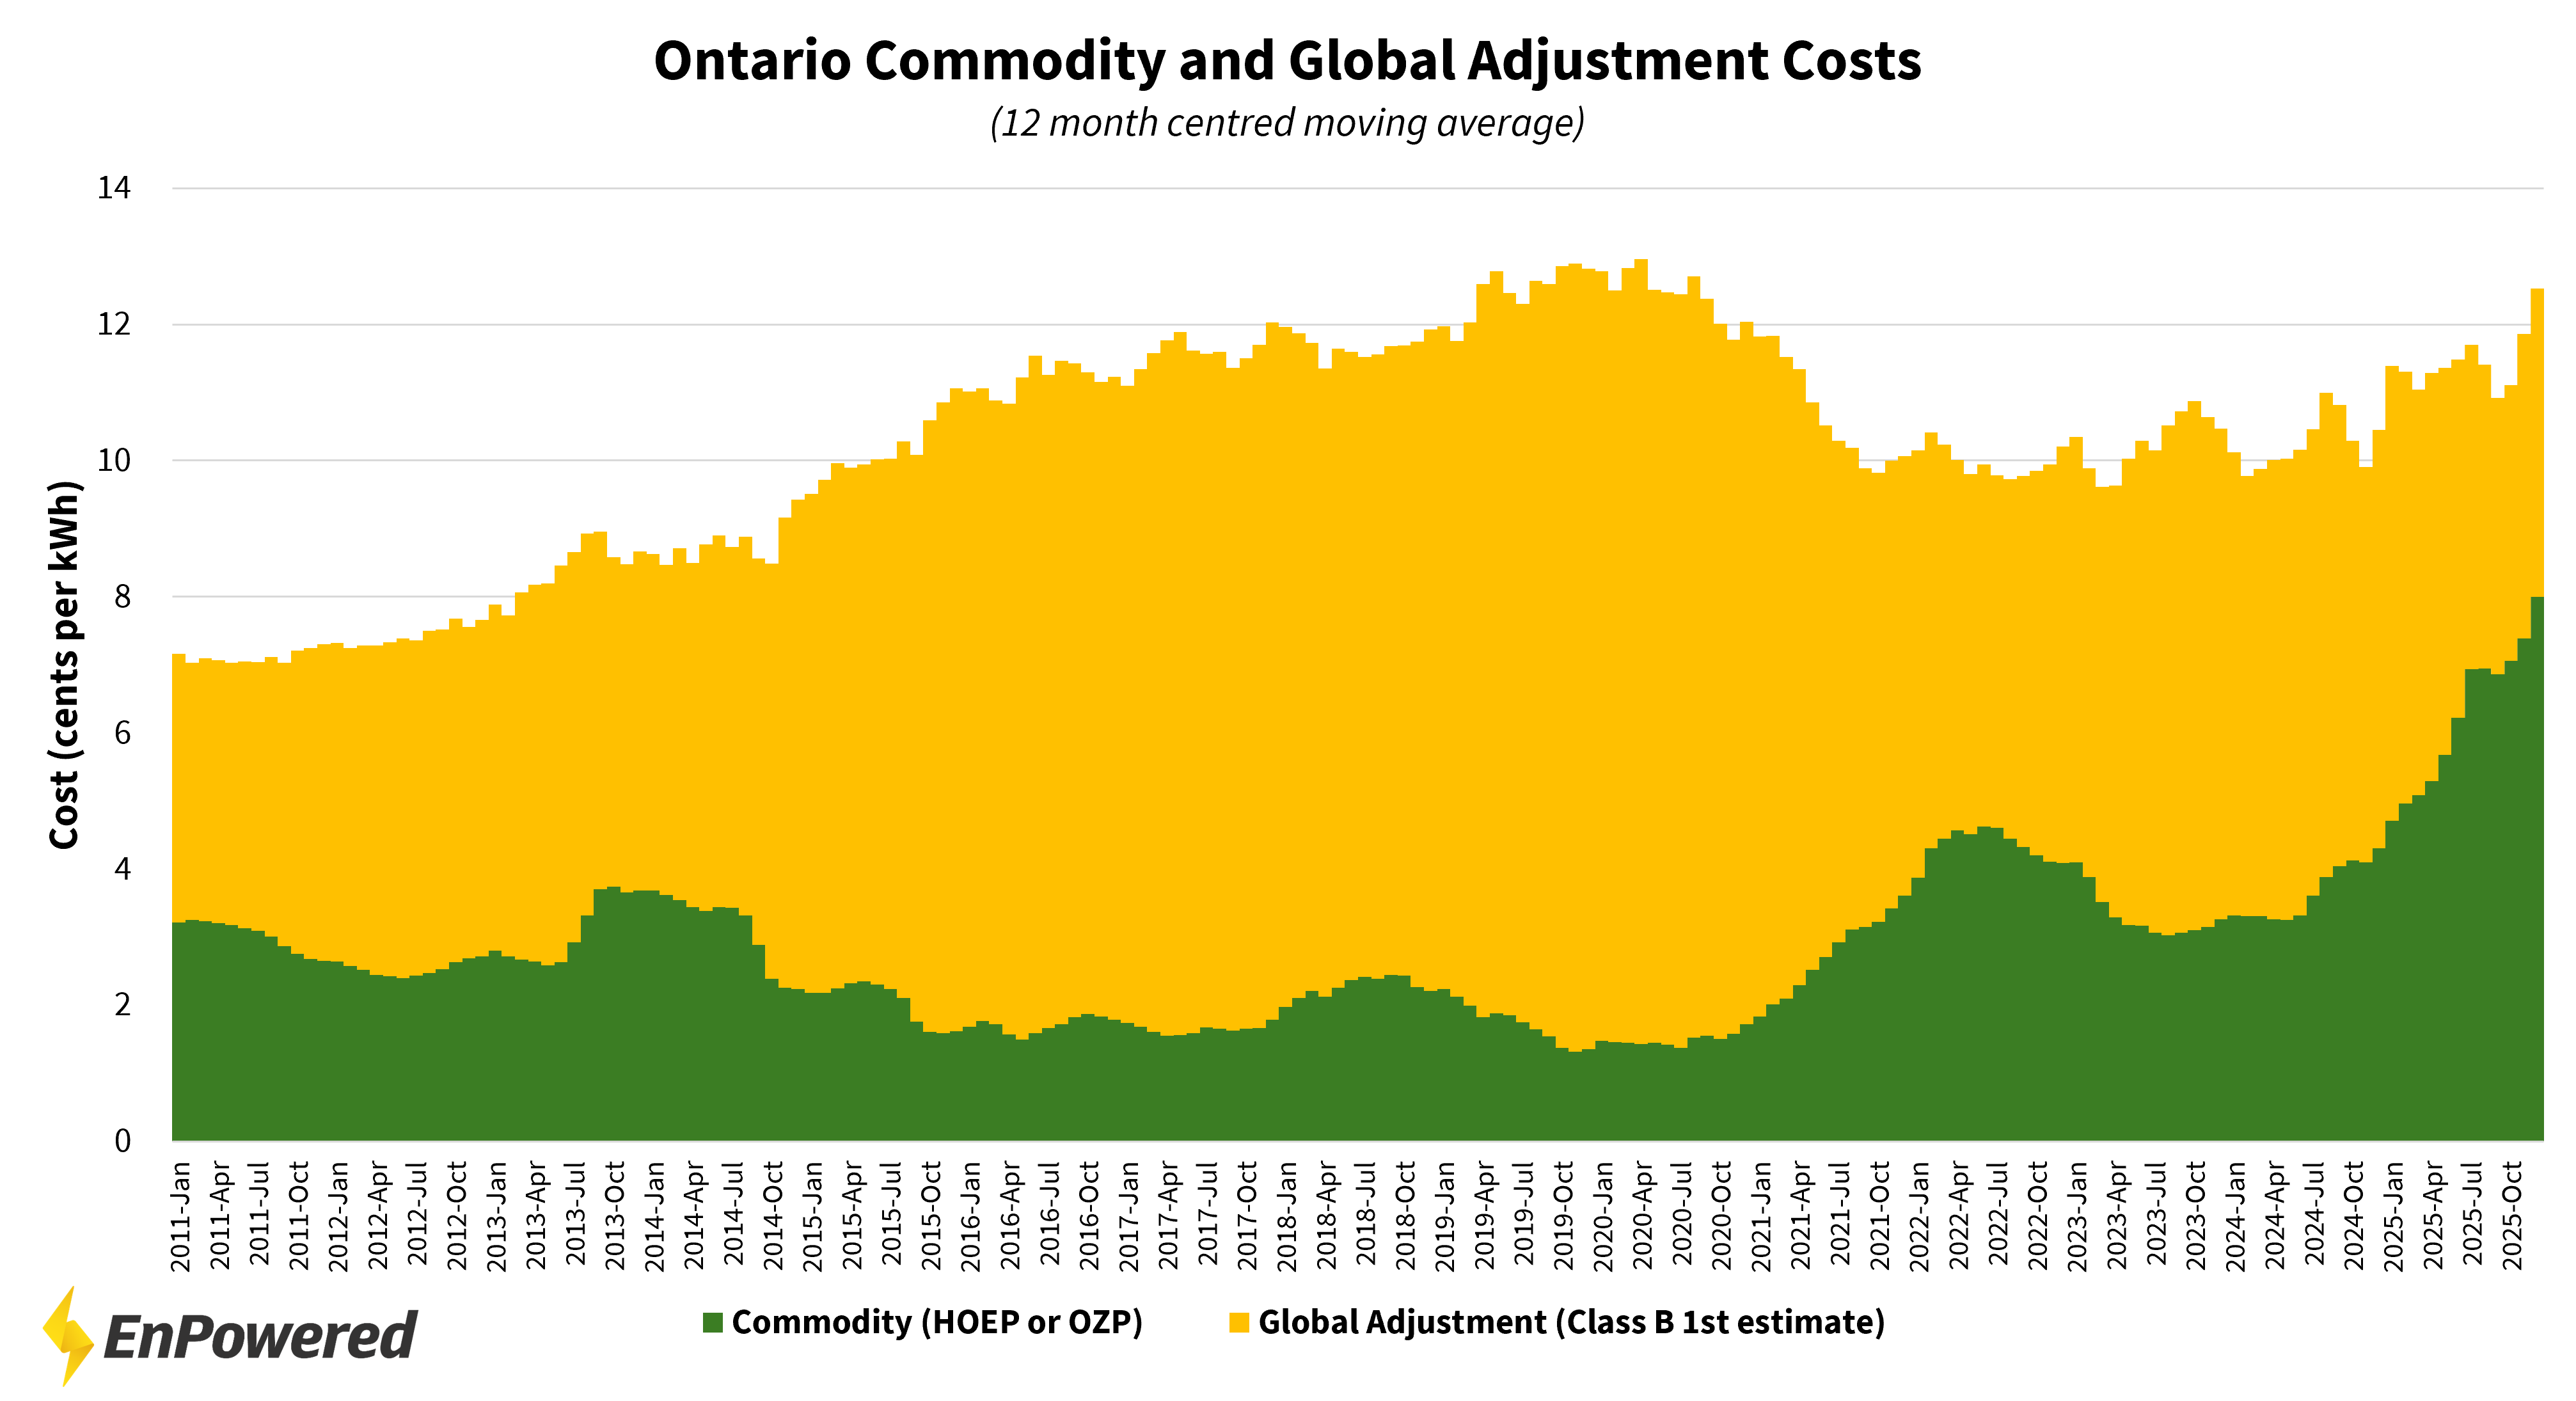
This relationship becomes particularly visible during shock periods. One example is the spike in commodity rates in 2022, caused in part by the global natural gas crisis following Russia’s invasion of Ukraine. As commodity rose sharply, GA dropped. More recently, in 2025, Ontario’s move to the Day-Ahead Market combined with unusually cold winter temperatures and generator refurbishments (especially amongst nuclear facilities) pushed commodity prices higher again, and GA responded by falling.
While the monthly data appears chaotic, the rolling average reveals a consistent long-term structure: commodity volatility absorbs short-term events, while GA adjusts to keep the overall system whole.
The Total Cost of the System Has Been Rising for More Than a Decade
When we look at the combined cost of commodity and GA, a long-term upward trend becomes visible. From 2011 through late 2020, total electricity costs rose steadily as Ontario paid for contracted generation, system upgrades, and new capacity resources.
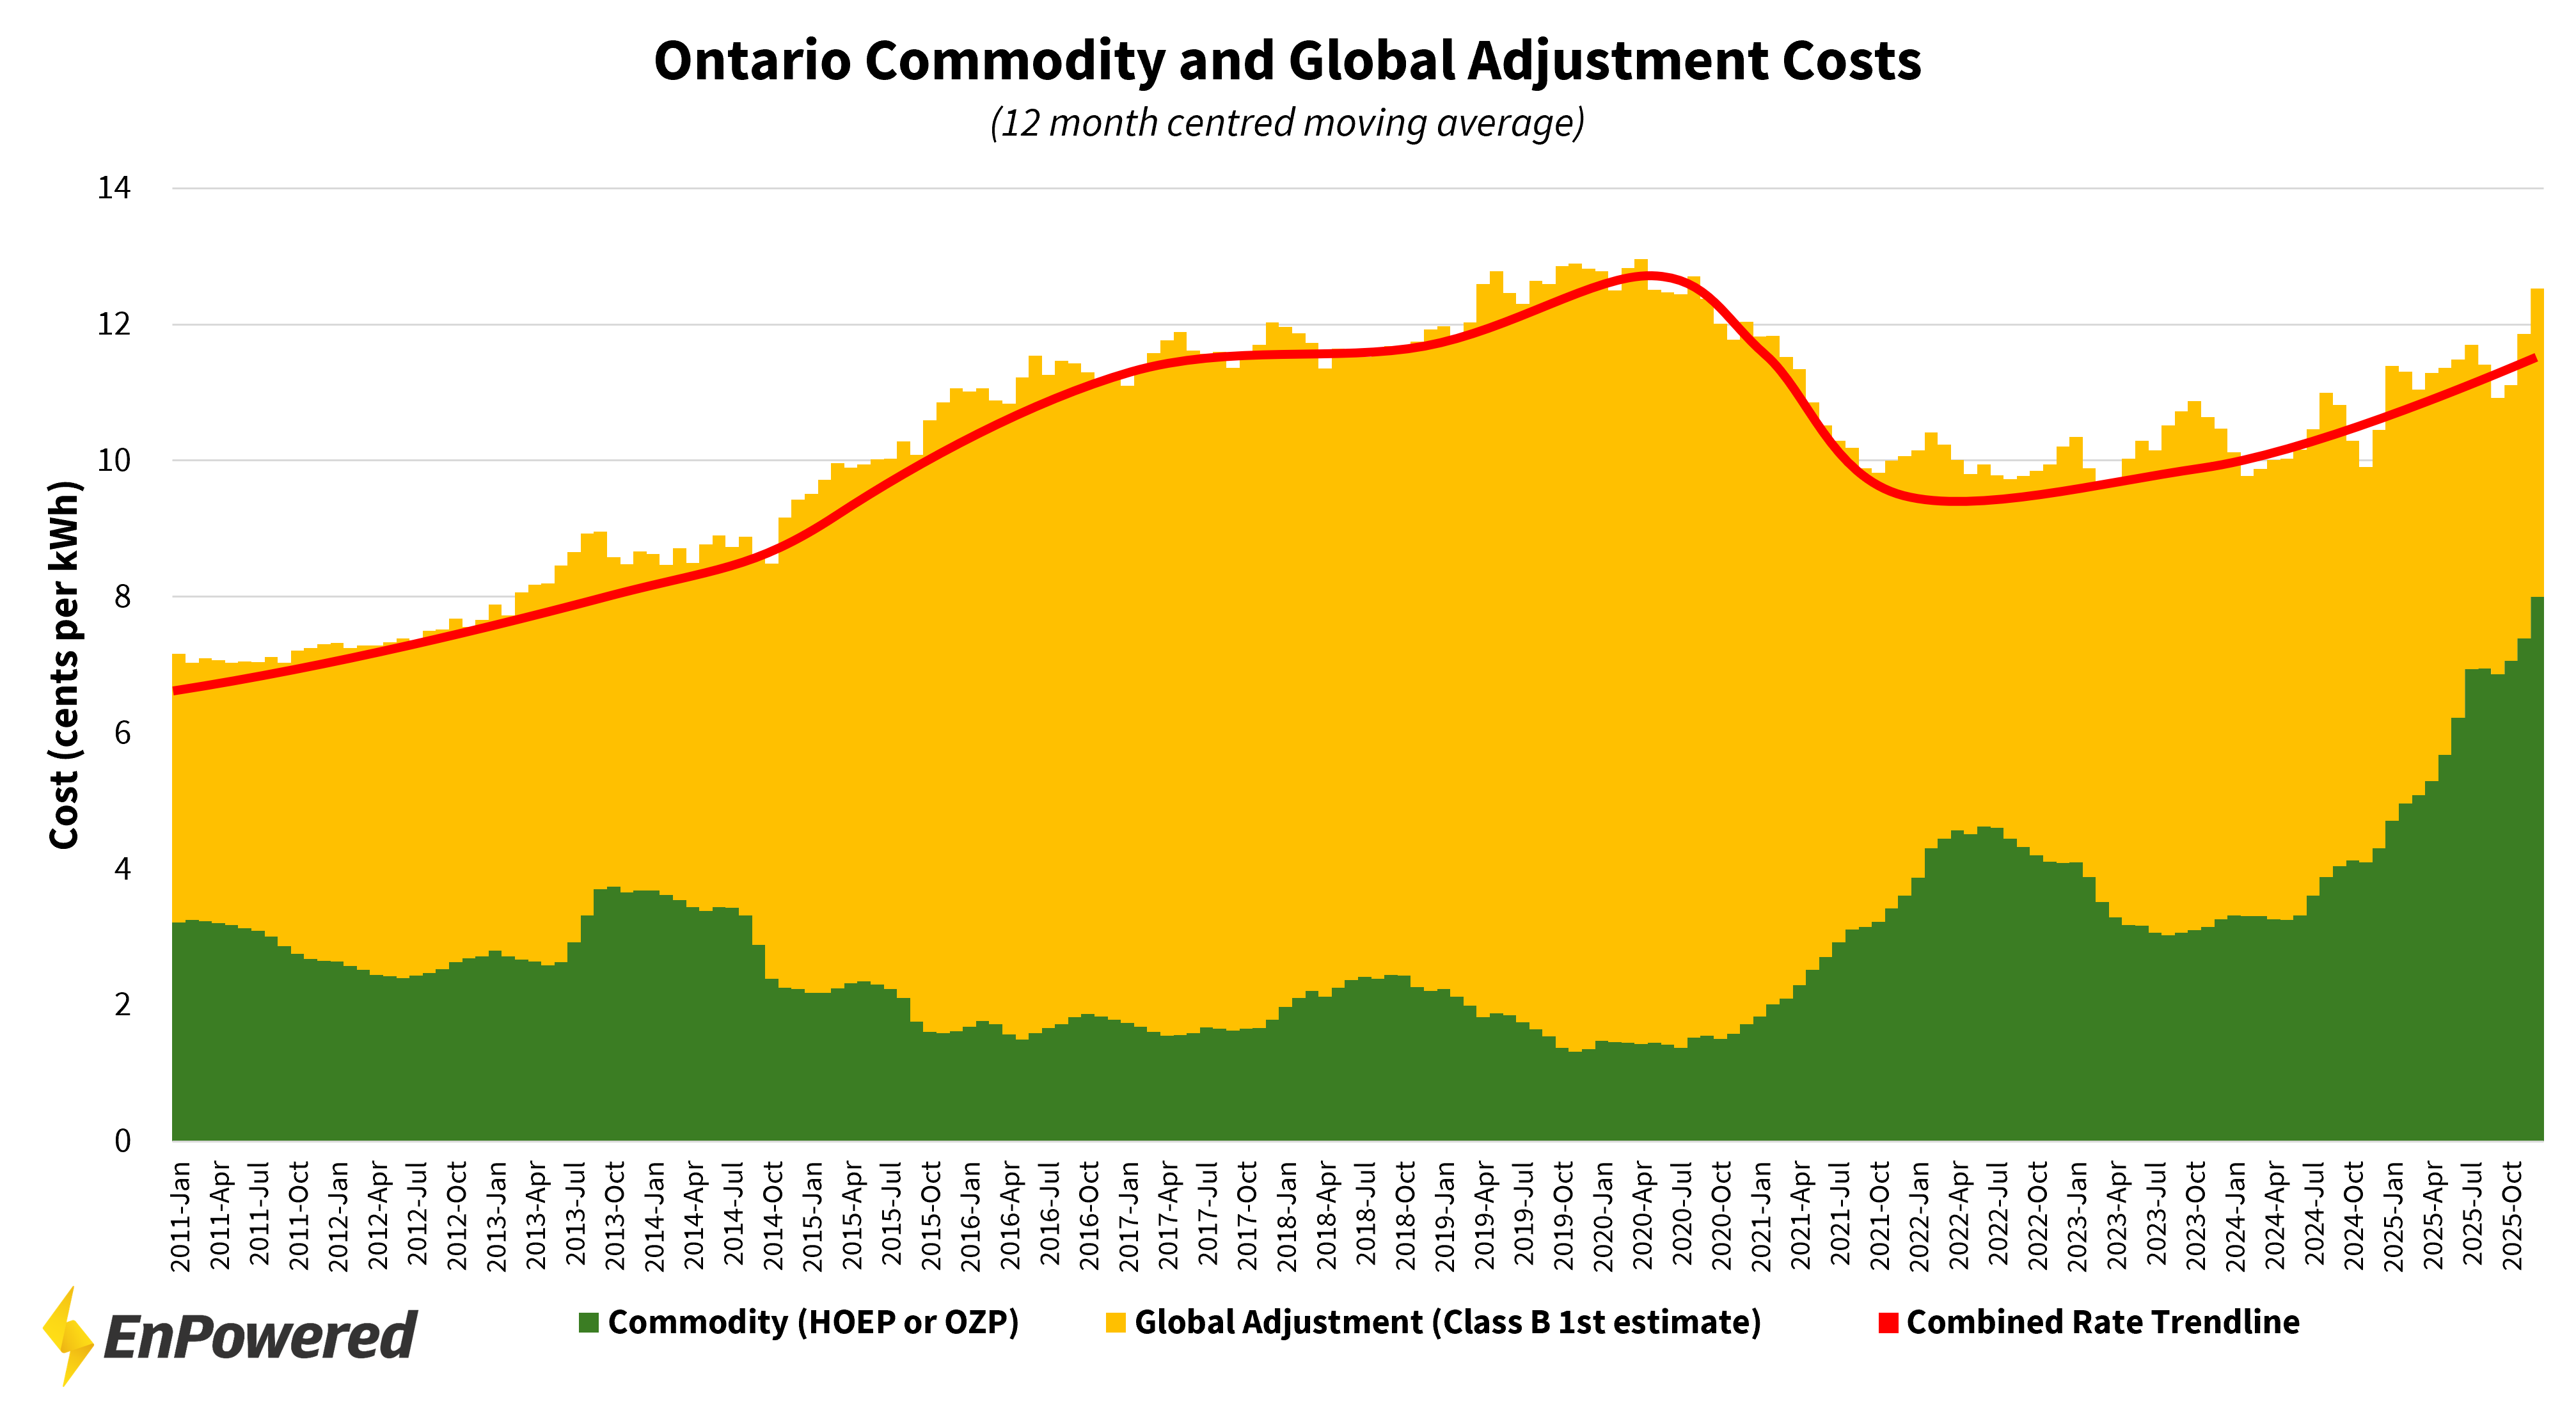
In 2021, the combined rate drops significantly – but this was not the result of falling system costs. Instead, the provincial government shifted a portion of the GA cost bucket into the tax base, reducing the GA line on customer bills even though the underlying obligation to generators remained unchanged. In other words, the accounting changed, not the economics.
Following that reclassification, the combined rate began rising again, reflecting the same structural pressures seen before: aging assets requiring refurbishment, contracted resources with escalating payments, and growing capacity needs across the province. The system costs that drive GA and commodity continue to increase over time, regardless of which line item they appear under.
Looking Forward: Three Indicative Scenarios for the Next Three Years
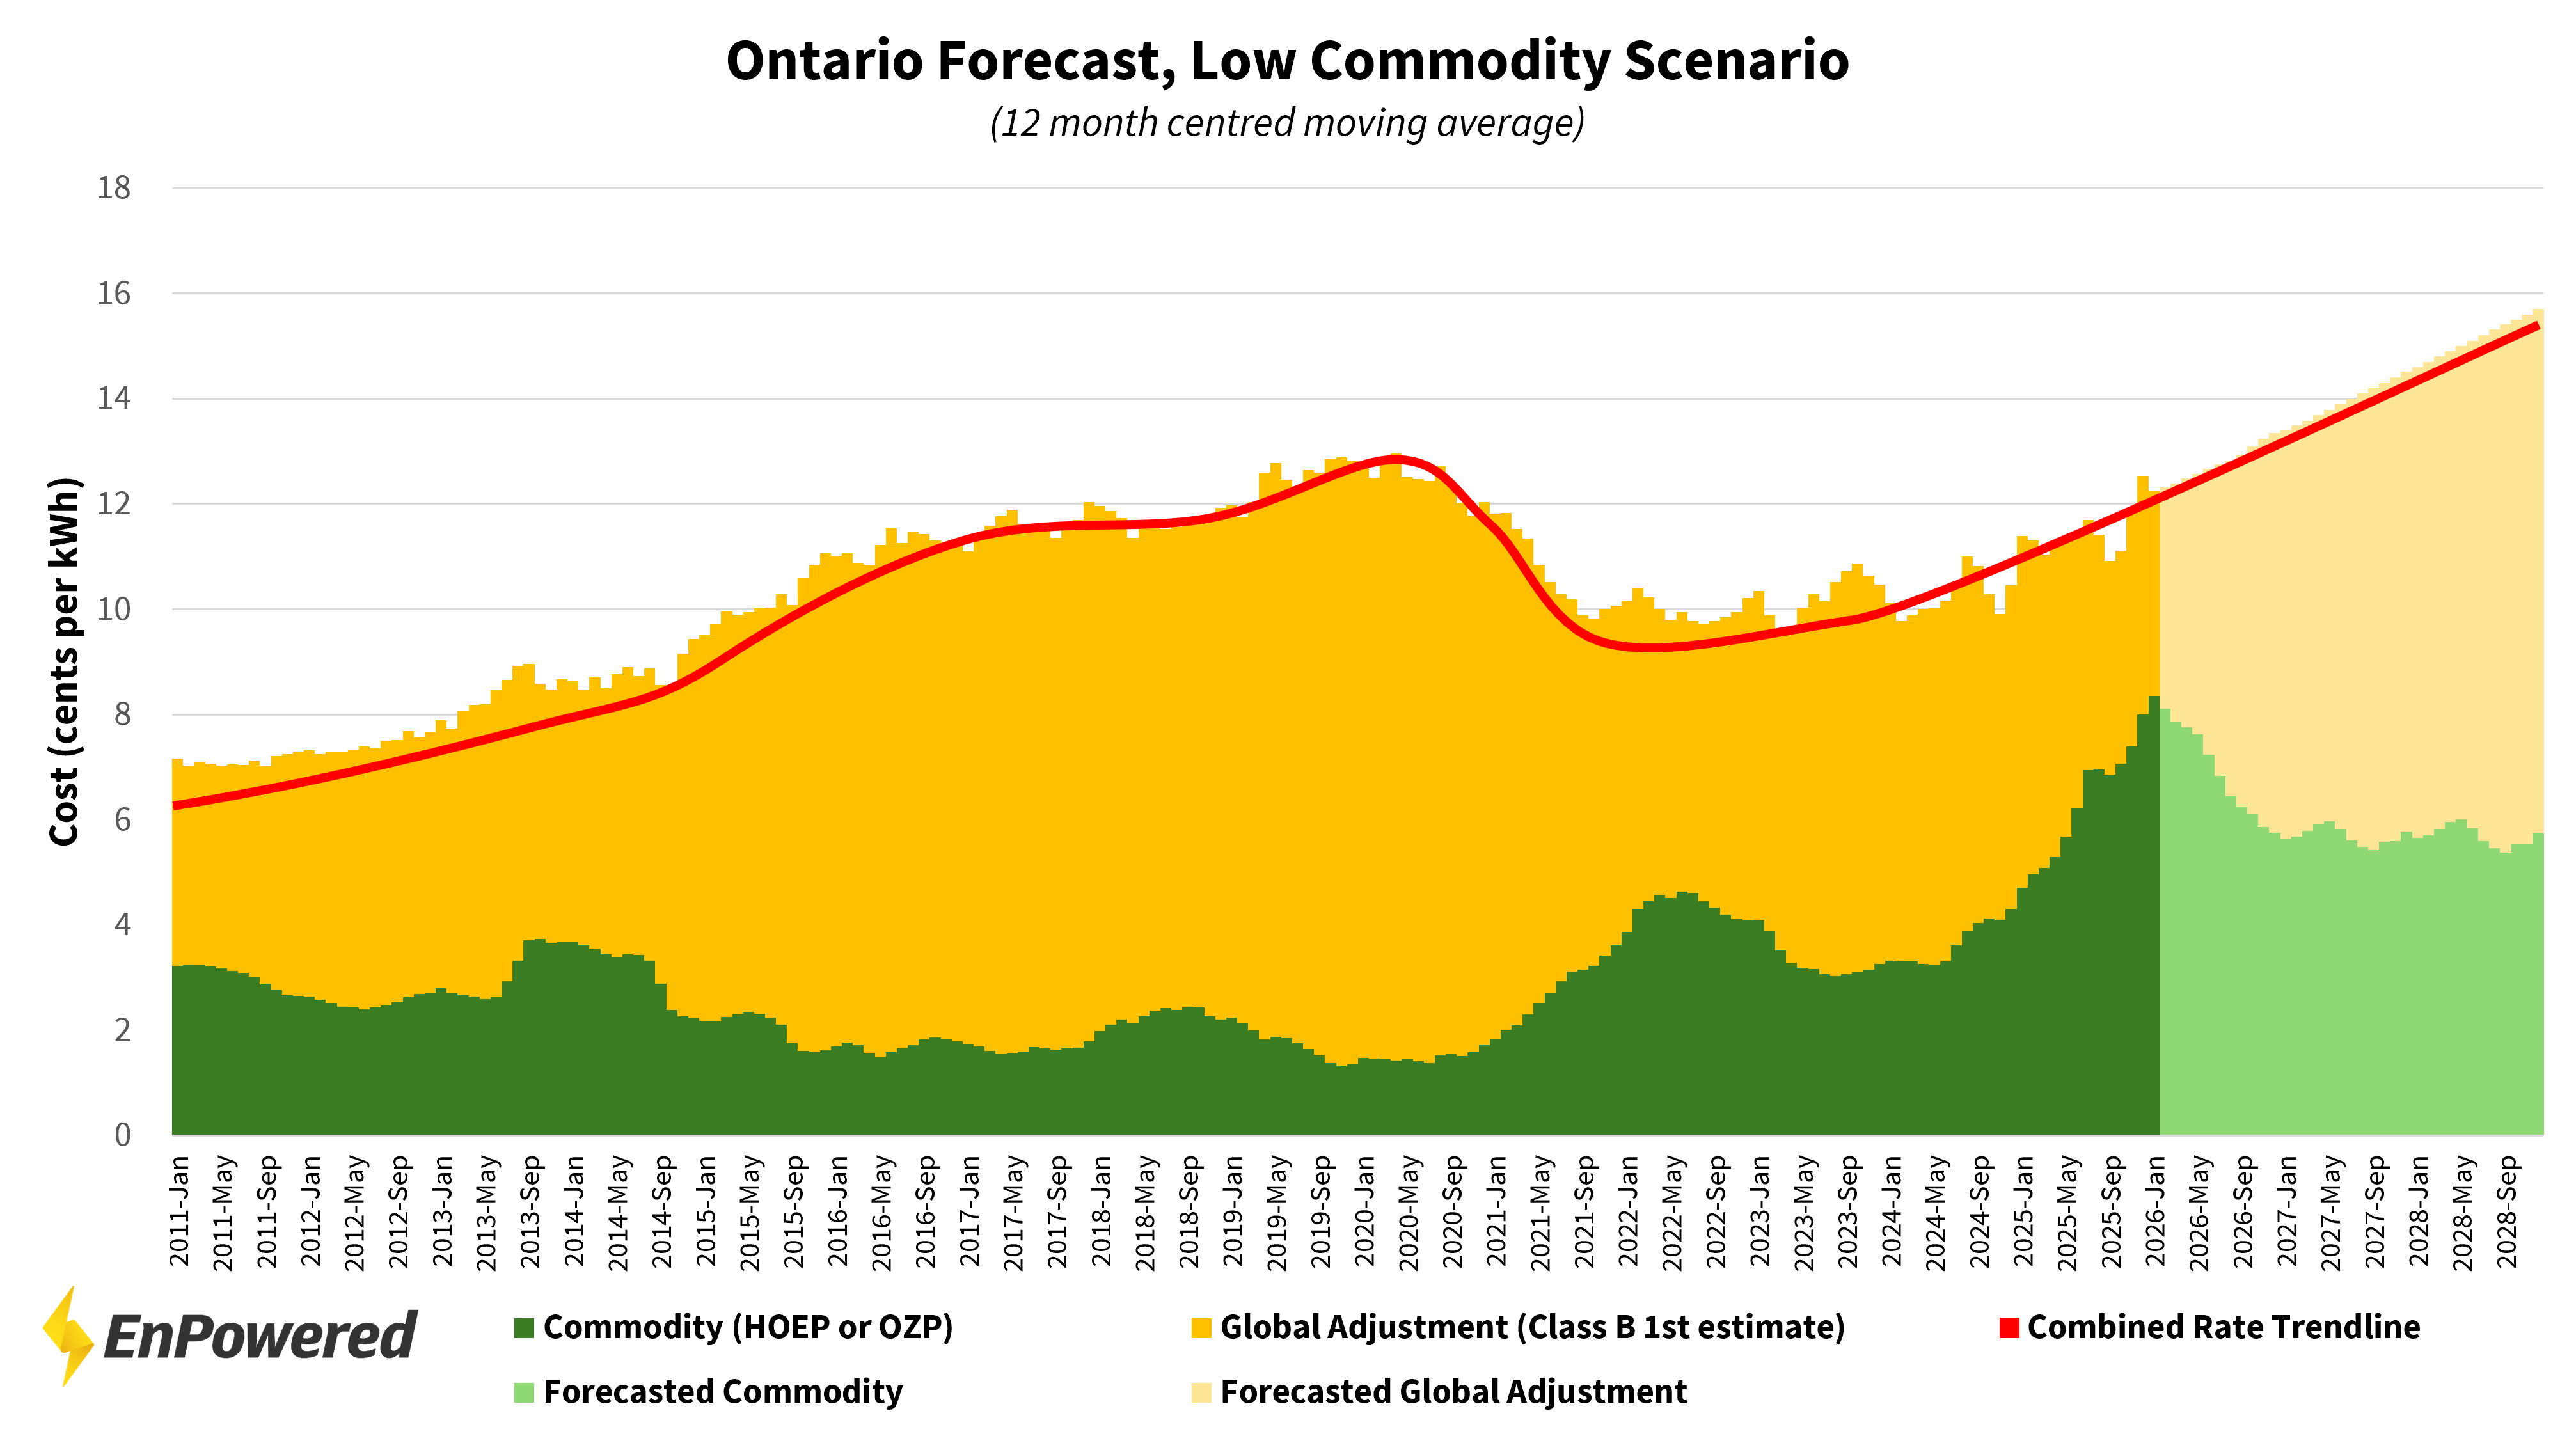
While no one can predict electricity markets with certainty – and EnPowered does not provide commodity forecasts – we can outline several illustrative pathways based on system fundamentals and historical responses to major events. These scenarios are designed to help businesses understand how total electricity costs, commodity rates, and Global Adjustment may evolve under different conditions.
Across all three, one insight remains consistent: even in the most extreme case, average GA over a 12-month period never falls to zero, because the overall system costs are expected to continue rising as the system continues to sign new contracts with generators and as Ontario’s grid load continues to increase. This doesn’t mean we won’t see months with zero or negative GA values, but the average GA over a year can be expected to remain positive.
Scenario 1: A Stable System With Strong Nuclear and Renewables
In the first scenario, Ontario’s nuclear refurbishments remain on schedule and future renewable additions continue. These generators supply relatively low-cost baseload, replacing more expensive natural-gas-fired generation as our main baseload supply. This reduces Ontario’s reliance on gas, reducing overall commodity rates.
Under these conditions:
- The commodity rate experiences an initial shock (similar to early 2022) due to the perfect storm of a new market structure, reduced supply from nuclear refurbishments, and increased demand from a colder winter, but then rates settle back down at a moderate rate.
- GA rises as commodity stabilizes, maintaining overall system revenue.
- The Day-Ahead Market becomes more orderly as fewer high-priced gas hours set the marginal price.
- Winter volatility remains, but does not dominate the annual profile as future winters are not as cold as the 2025-2026 winter.
This scenario represents a return to stability, though not to the low commodity prices of the mid-2010s as we show commodity rates settling around 5 cents/kWh. In this scenario, global adjustment rates start around 5 cents/kWh before rising to 9 cents/kWh after 3 years.
Scenario 2: Delayed Nuclear, Continued Gas Reliance, and More Harsh Winters
In the second scenario, nuclear refurbishments proceed more slowly than expected. Ontario remains reliant on natural gas to cover both peak and baseload needs, and we experience several more colder-than-average winters similar to the 2025-2026 winter.
Under this path:
- Commodity prices drop slightly as the initial price shock ends, but they remain elevated as gas generation continues to set prices in the day ahead markets.
- Repeated cold winters result in high commodity prices during winter months, which drives up the average commodity price each year.
- The total combined rate still increases steadily as additional generation is added to the system to increase supply.
- Even as commodity prices remain high year-over-year, GA prices remain stable as overall system rates increase.
This scenario reflects the conditions experienced in the 2025-2026 winter season reasonably well: structural reliance on gas, combined with seasonal volatility, pushing commodity higher. However, the difference between Scenario 1 and 2 ultimately depends on whether this past winter was a unique “perfect storm” of circumstances (a new market structure, decreased supply, and increased demand) or whether this can be expected to repeat again next winter. In this scenario, commodity averages between 6-10 cents/kWh and GA stays flat between 5-6 cents/kWh.
Scenario 3: A Major Global Shock Drives Prices Much Higher
In the final scenario, Ontario continues relying on gas while the global energy market experiences another major disruption – similar to or worse than the surge in gas prices resulting from the Ukraine war in 2022. This could be geopolitical, supply-chain driven, or related to rapid shifts in LNG demand worldwide.

In this environment:
- Similar to scenario 2, commodity prices drop slightly after the initial price shock, but they remain elevated as gas generation continues to set prices in the day ahead markets.
- Commodity then spikes even higher over future years as natural gas prices rise fast and continue to set prices in the day ahead markets.
- Even in this extreme scenario, GA falls but never reaches zero on average over a 12 month period. This is because overall system costs continue to increase steadily as additional supply is contracted.
This scenario is unlikely to materialize every year, especially given that the North American natural gas market is largely insulated from global price shocks, but it’s helpful to model this outlier scenario to show what effects it would have on commodity and GA rates. Importantly, although we would expect to see months with low or even negative GA rates, the overall 12 month average would remain positive.
What This Means for Ontario Businesses
Across all historical periods and future scenarios, one finding is consistent: the combined cost of commodity and GA continues to rise over time, regardless of the short-term fluctuations between the two.
While many businesses are focused on whether GA or commodity is rising in a particular month, the more important finding is that total costs continue to climb. With this increased market volatility, the incentive to invest in flexible assets such as batteries or generators only increases.
As we highlighted in our recent articles, customers who can shift load, operate generators strategically, or cycle batteries daily will increasingly benefit from these hourly and monthly price dynamics. Ontario’s market is changing – but it is also becoming more transparent, more price-responsive, and more rewarding for businesses that adapt.

Related Resources