
Electric vehicles (EVs) have substantially lower lifetime emissions than fossil-fuel powered cars, even when emissions from battery manufacturing and electricity generation are included.
TL;DR
-
By 2050, 1 in 2 cars are projected to be electric, and their retired EV batteries can be reused for mass energy storage.
-
Emissions from EV production are higher than traditional vehicles, due to battery assembly but this deficit is ‘repaid’ in as little as 18 months if the vehicle is charged with renewable energy.
-
Electricity generation mix is vital to calculating EV operational emissions, and in some jurisdictions with carbon-intensive grids it is actually more environmentally friendly to drive a hybrid vehicle.
You may have come across statements claiming that electric vehicles (EVs) actually have a higher carbon footprint than internal combustion engine (ICE) vehicles, especially smaller, fuel efficient models. The crux of this argument centres around the nature of battery manufacturing, as well as the energy mix that EV drivers are using to charge their vehicles.
These are important elements to consider which we will discuss later; however, “the idea that electric vehicles could increase emissions is a complete myth,” explains Dr. Florian Knobloch of the University of Nijmegen. “We’ve seen a lot of discussion about this recently, with lots of disinformation going around.”
In this article we’ll be looking at the following contentious EV myths:
- Electric vehicles, due to their manufacture have higher lifetime emissions than conventionally power vehicles
- Electric vehicles produce more emissions than ICE cars due to carbon-intensive electricity generation
With this in mind, let’s take a deep dive to unpack the carbon calculus of the EV industry, as some EV myths are based on verified (albeit cherry picked) data.
State of the electric vehicle market
Before we look at the EV myths mentioned above, let’s take a brief detour to learn about the state of the global EV market and market trends. Going forward, 17 countries (including; India, France, UK, Germany, Canada, and China) and 12 US states, have announced plans for 100% zero-emission vehicle targets or the phase out of (ICE) vehicles through 2050.
Specifically, 11 EU countries have pledged to implement said plans by 2040, with several nations (e.g. UK, Germany, Netherlands, Sweden) pledging to do so by 2030. India has also announced a 2030 deadline for phasing out fossil fuel vehicles.
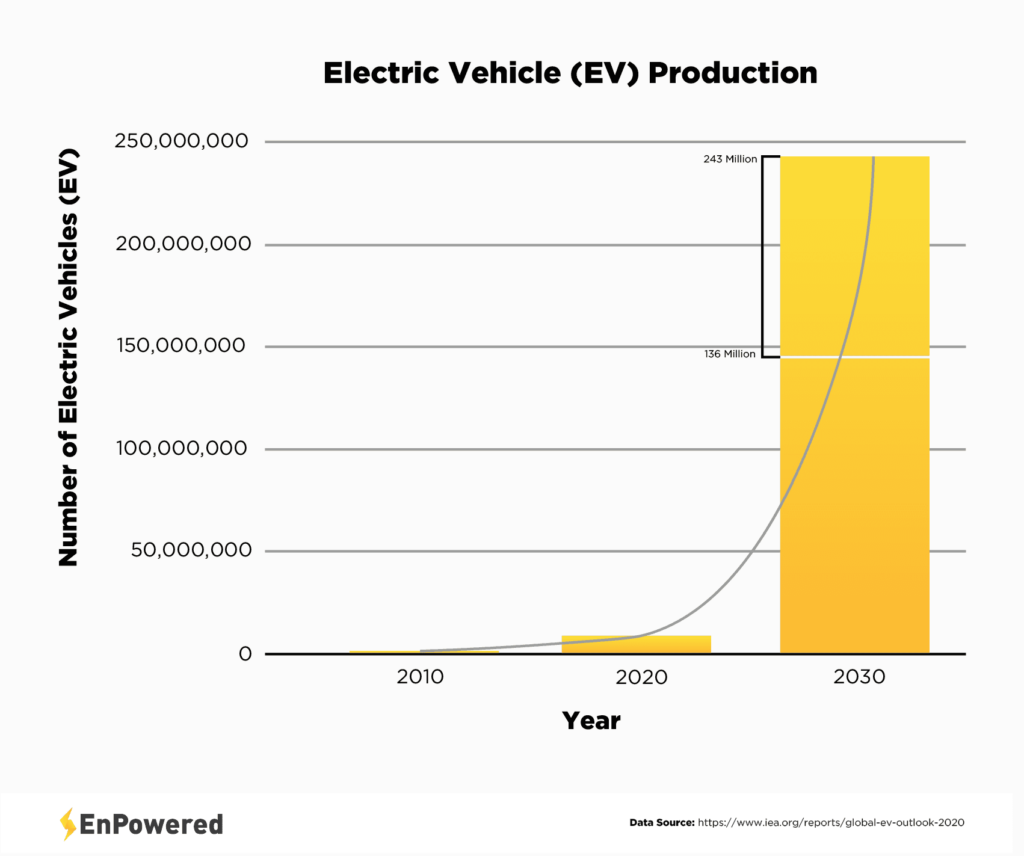
While EVs only represented 2.6% of global car sales in 2019, the sector has seen a 40% year-on-year increase in sales between 2018-2019 to reach 2.1 million globally. To put this in perspective, there were 7.2 million EVs in the world in 2019, a massive jump from just 17,000 in 2010.
The International Energy Agency (IEA) projects (depending on growth / adoption trends) between 136 million and 243 million EVs globally by 2030.
By 2050, 1 in 2 cars are projected to be electric, leading to an emissions reduction of 1.5 gigatonnes; the same as all of Russia’s emissions. Battery costs have also decreased 85% since 2010, with 2018-19 versions of some models displaying 20-100% higher battery energy density than their 2012 equivalents. On that note, let’s move on and tackle the myth surrounding EV battery emissions.
EV manufacturing and lifetime emission calculations
Like all persistent myths, the claim that EVs have higher lifetime emissions due to how they’re produced has a kernel of truth. From the beginning of the assembly process to the moment when an EV rolls off the assembly line, it is true that producing an EV emits more emissions than a ICE powered car.
According to the International Council on Clean Transportation (ICCT), “battery manufacturing emissions appear to be of similar magnitude to the manufacturing of an average internal combustion engine vehicle, or approximately a quarter of an electric car’s lifetime emissions.”
Of these, 50% of a battery’s lifetime emissions come from the electricity used in the manufacturing process. It is important to note that estimates of emission from battery production vary by a factor of 10, depending on manufacturing process, type of battery, electricity sources, amount of recycled material utilized, and many other factors.
A selection of estimates range from 56 to 494 kilograms of CO₂ per kW/h of battery capacity, or 1-2 grams of CO₂ per kilometer driven per kW/h of capacity.
If we ignore high-renewable energy generation scenarios and model EV and conventional vehicle production chains using the current generation mix, EVs’ emission debt is quickly negated. Specifically, this higher emissions debt is, on average, paid off in just 2 years, even if the vehicle is being charged by electricity generated from fossil fuels such as natural gas or oil.
This ‘repayment’ period decreases to 18 months if the EV is being charged with renewable energy. Even in countries with substantial coal power (such as Germany), this repayment period is not longer than 3 years.
In other words, using mid-range battery production emissions estimates (175kg CO₂ per kW/h), lifetime EV battery emissions equate to 35g of CO₂ equivalent per kilometer driven. This means that – together with electricity emissions – the average electric car in the European Union still produces 50% fewer emissions than an average European combustion engine vehicle over the first 150,000 kilometers of driving.
The National Renewable Energy Laboratory in Golden, Colorado identifies utility-scale peak shaving as the most promising opportunity for second-life batteries.
The use of electricity from low-carbon or zero-carbon generation sources negates any production cycle-related emissions debt. Grid decarbonization is therefore a vital step in our efforts to green the EV production cycle.
For instance, a 30% decrease in grid carbon intensity reduces emissions from the battery production chain by around 17%. Similarly, recycling batteries based on current methods can reduce lifetime battery emissions by 7-17%, depending on percentage of material recycled.
We have already seen that battery energy density has substantially increased since 2012, and this trend also helps reduce emissions. Specifically, higher energy density leads to 10-15% fewer manufacturing-related emissions or 6% fewer lifetime grams of CO₂ equivalent per kilometer.
Conversely, building larger (but less dense) batteries can increase manufacturing-related emissions by between 33-66%, translating to an 18% increase in lifecycle grams of CO₂ per kilometer.
An important element of EV batteries is their dual use (either while still in vehicles or after removal) as grid connected energy storage. EV batteries retain 75-80% of their original capacity after their vehicle use phase, which means they can be repurposed as energy storage for the grid, helping support intermittent renewables.
Research points to EV batteries having a useful second-life of around 10 years. So even if we assume a lower remaining capacity of 60% over 10 years, this second lifecycle phase can extend battery use life by 72%, resulting in a corresponding decrease in per kilometer emissions (due to battery manufacture) by 42%.
The ICCT has reported that “the National Renewable Energy Laboratory in Golden, Colorado identifies utility-scale peak shaving as the most promising opportunity for second-life batteries.” Similarly, the IEA has projected that between 100 to 120 GWh of electric vehicle batteries will be retired by 2030 and thus be available for grid storage.
This is in addition to the 16,000 GWh stored globally in EVs by 2030 based on the high end EV adoption numbers outlined earlier. Naturally most of this capacity will be in use powering vehicles, yet even accounting for this together with the constraints of timing, availability, and other grid access issues, the IAE projects that 5% of global EV battery capacity – 600GW – will be available during Peak times globally.
This includes 163GW in the EU and 90GW in the United States.
EVs and emissions from electricity generation
A further claim raised by EV detractors is that electric vehicles produce more emissions than ICE vehicles due to carbon-intensive electricity generation. Once again there is a kernel of truth to this assertion, since EVs do produce more emissions in certain, select circumstances. For instance, based on data from 2015, driving an EV in coal-dependent Germany actually led to slightly higher emissions than driving the most efficient gasoline-powered model, but still less than average vehicles.
That being said, research by Exeter, Nijmegen, and Cambridge universities has shown that EVs produce on average 50% less emissions than combustion-powered vehicles in 95% of the world’s markets. In other words, out of 59 global regions studied, EVs already produce less emissions in 53 of these regions – including China and the United States.
EVs are more efficient than ICE vehicles in all 50 US states, but significant regional differences in emissions efficiency do exist.
The range of emissions savings depends on local generation mixes, with EVs producing 70% less emissions in areas (e.g. France, Sweden) served by large renewable / nuclear generation or around 30% in more carbon intensive markets, such as the UK.
In the United States the current generation mix still sees EVs produce, on average 50% fewer lifetime emissions than ICE cars. If you’re in the US and curious about the EV emissions, the Department of Energy offers an emissions calculator to determine hybrid and EV emissions based on each state’s generation profile.
EVs are more efficient than ICE vehicles in all 50 US states, but significant regional differences in emissions efficiency do exist.
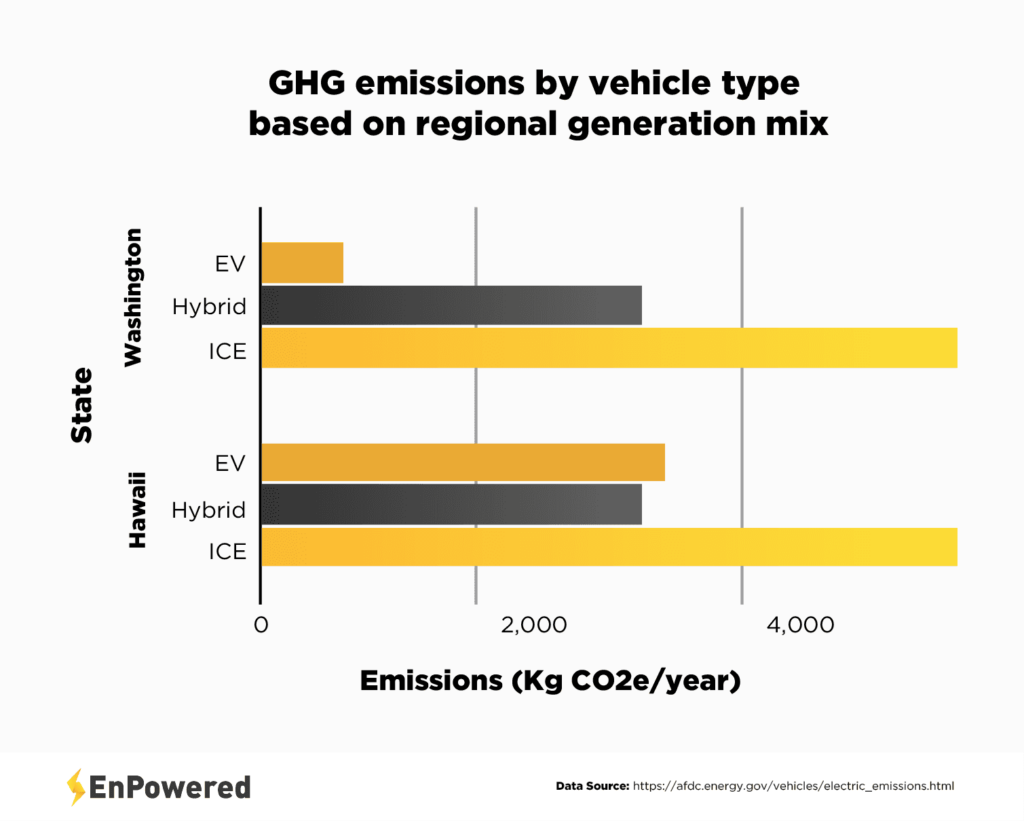
For example, Washington state produces almost 80% of its electricity from renewable or zero-emission sources. An ICE vehicle in Washington produces 5,186kg of CO₂ equivalent each year, a hybrid produces 2,838kg while an EV produces only 607kg per year.
On the other hand, if we look at Hawaii, where fossil fuels account for over 85% of generation, the emissions savings from buying an EV are reduced. In Hawaii, an EV produces 3,014kg of CO₂ equivalent annually compared to the 5,186kg produced from an ICE vehicle. It is interesting to note the fact that EVs actually produce more emissions than hybrids (2,838kg per year) in Hawaii, due to the state’s highly carbonized grid.
Similarly, for readers in Canada the Canada Energy Regulator provides emissions comparisons based on car model and provincial generation mix. Over 80% of electricity generated in Canada is from renewable or zero emission sources, yet sizable differences in EV emissions exist between provinces.
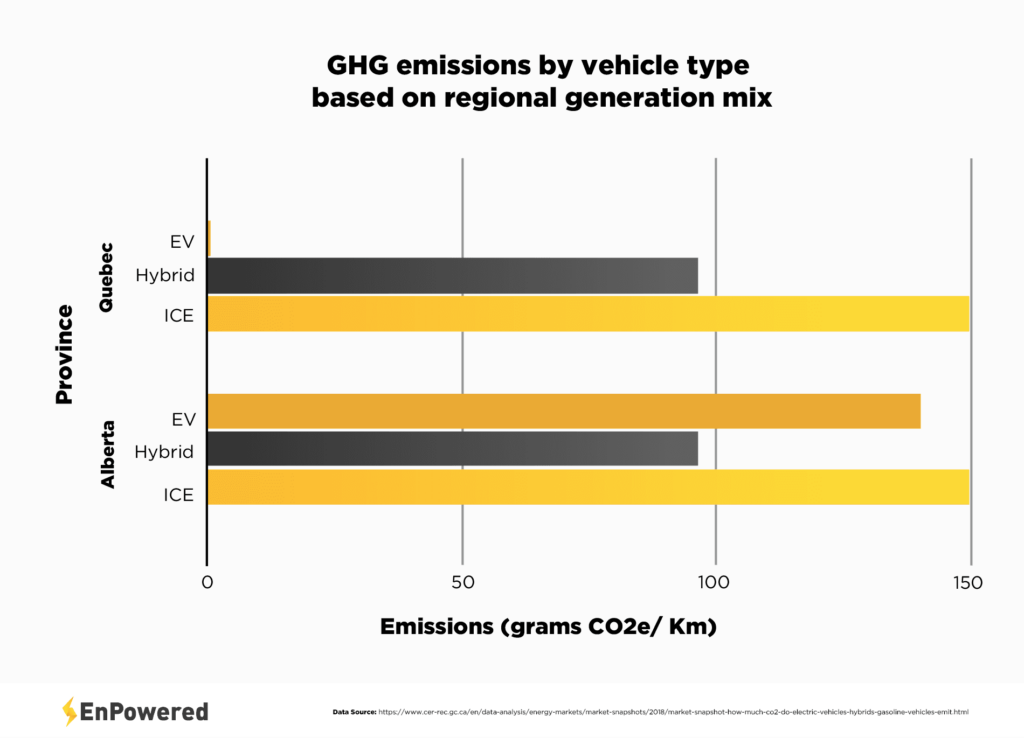
Provinces like Ontario, Quebec, Manitoba, and British Columbia have negligible electricity related emissions, with Quebec producing just 1.7g of GHG per kW/h. As a result driving the most efficient ICE model produces 149.6g of GHG per kilometer, compared to 96.2g for the best performing hybrid and just 0.3g of GHG per kilometer for EVs.
At the opposite end of the spectrum, Alberta has the most carbon intensive grid in Canada, with 900g of GHG generated per kW/h.
This results in several efficient ICE models outperforming many EV models in terms of emissions, although some EVs, particularly hybrids still outperform the most efficient ICE models. For comparison, the best performing hybrid model emitted 96.2g per kilometer compared to the best EV (139.8g) and ICE model (149.6)
What we’ve seen is that in some select circumstances, driving an EV can produce more emissions than an ICE vehicle, but in the overwhelming majority of regions EVs handily outperform conventional autos. A further takeaway is that decarbonizing electric grids is the single largest step that regions can take to improve both the emissions profile of EVs and GHGs from manufacturing all vehicles, electrical or otherwise.