The Industrial Conservation Initiative (ICI) is made up of two class of customers – Class A and Class B.
In this five-part series called ‘Tame the Beast,’ the goal is to help you understand:
- Part One: The Different Players in the Ontario Electricity Market
- Part Two: What Happened to Ontario’s Electricity Price
- Part Three: The Impact of Electricity Peaks and What is Global Adjustment
- Part Four: Companies are Trying to Reduce Electricity Costs
- Part Five: How Companies are Reducing Global Adjustment Costs
As covered in the previous section, there are two major groups of customers in Ontario – the Industrial Conservation Initiative (ICI) Class A participants who are the largest energy consumers in the Province, and the Class B composed of everyone else.
The former who are attempting to predict the energy demand in the Province and in turn trying to reduce their energy loads during peak periods. At the same time, the number of businesses that are eligible for Class A has grown rapidly and this eligibility expansion in the ICI Program has led to an increasing number of interested parties pursuing the Program.
This is simply because each want to access enormous savings. By properly managing the ICI Program, a business can save up to 70% of its annual electricity costs as a Class A customer.
To do so, a business would need to predict when each of the top five peak hours will occur each year, and then lower its electricity usage as much as possible during those hours. The top five peak hours are the five hours each year when the electricity usage in the Province of Ontario is at its highest.
With an increased number of companies designating as Class A and consequently attempting to predict the peak hours it has become increasingly difficult to accurately predict when these peaks will occur.
The reason for this is a concept, known as chaos theory, is that the more participants involved in a certain event, the more difficult that event becomes to predict. With the expansion of the ICI Program, and the addition of many new Class A customers, there are now more players than ever trying to predict and respond to the top five peak hours.
Most of these Class A customers are using publicly available peak predictions offered by the IESO through its Peak Tracker. However, it is very difficult to stay ahead and beat the market when you are using the same data as everyone else.
As many market players use the same publicly available predictions as the basis for demand response efforts, Ontario has begun to experience a large increase in what are now known as “False Peaks” and “Double Peak” days.
The IESO publishes its predictions of the Province’s electricity usage publicly each day, by updating the information on its Peak Tracker portal. This data is used by many companies to predict when a peak hour will occur. These publicly available predictions are often used by Global Adjustment Class A customers and other market actors to decide when, or if, they should reduce their electricity usage.
In fact, the majority of energy consultants in Ontario do not go beyond this publicly available Peak Tracker for their analyses of the energy market. As a result, most of the decisions made by Class A customers on how to respond to peak hours are based on the same publicly available information.
This was not a problem when there were only a few dozen Class A companies responding to peak days, but with thousands of companies now responding, this publicly available peak tracker is becoming increasingly unreliable. This is not because the IESO Peak Tracker is particularly inaccurate.
In fact, it has a high accuracy of around 95%. Rather, it is the very fact that the Peak Tracker is publicly available that makes the data from it unreliable. This is because as many market players use the same publicly available predictions as the basis for demand response efforts, Ontario has begun to experience a large increase in what are now known as “False Peaks” and “Double Peak” days.
 | From getting your project funded to finding savings once commissioned, contact us to ease the financial impact of your clean energy transition. Let's talk clean energy solutions. |
False Peaks and Double Peaks
A False Peak occurs when the publicly available predictions provided by the IESO estimate that a peak day will occur, causing many businesses to reduce their electricity usage, sometimes causing over 2,000 MW of electricity usage to suddenly shutdown.
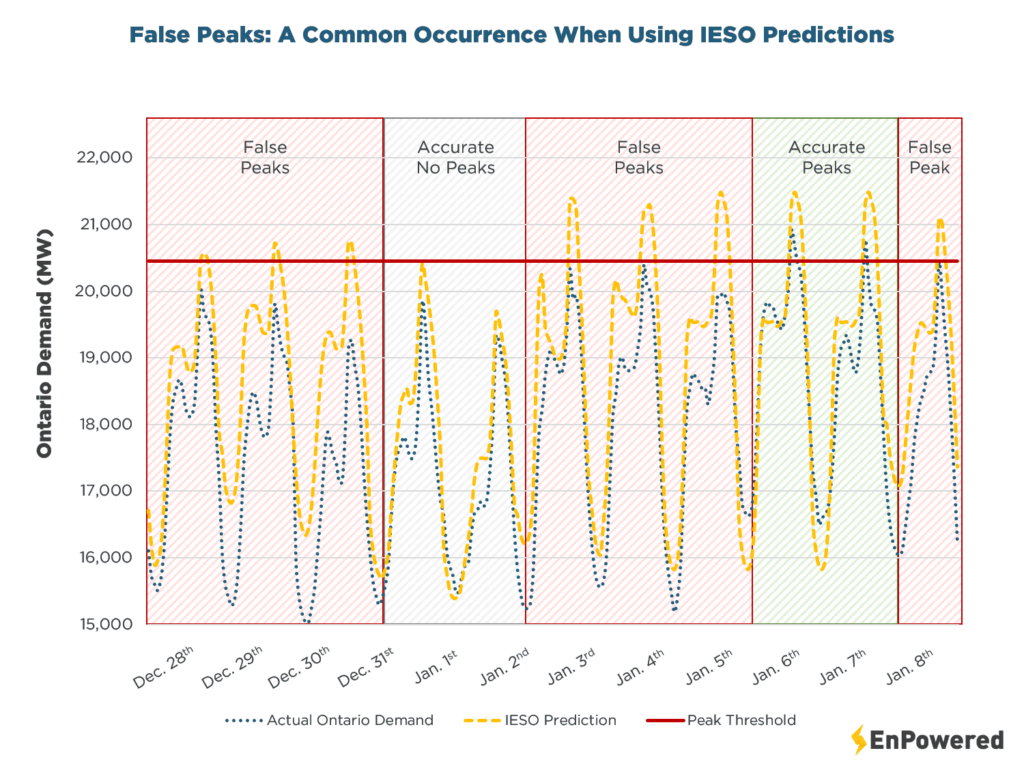
As a result of this demand response, actual electricity usage becomes much lower than predicted and consequently no peak day actually occurs. This becomes an even more severe problem during periods of prolonged cold, such as the cold snap that occurred in late December 2017 and early January 2018.
During this period, the publicly available IESO Peak Tracker repeatedly predicted that a peak day was imminent, but it repeatedly overestimated the actual usage in the Province. In fact, out of the 12 days between December 28th and January 8th, the IESO predicted that nine days had the potential to be a peak day.
In actuality, only two of these days became peak days. For many businesses operating during the holidays, this caused major disruptions to operations.
Due to the inaccuracy of the publicly available IESO data, many businesses repeatedly shut down operations in an attempt to reduce usage during peak days, most of which never actually transpired.
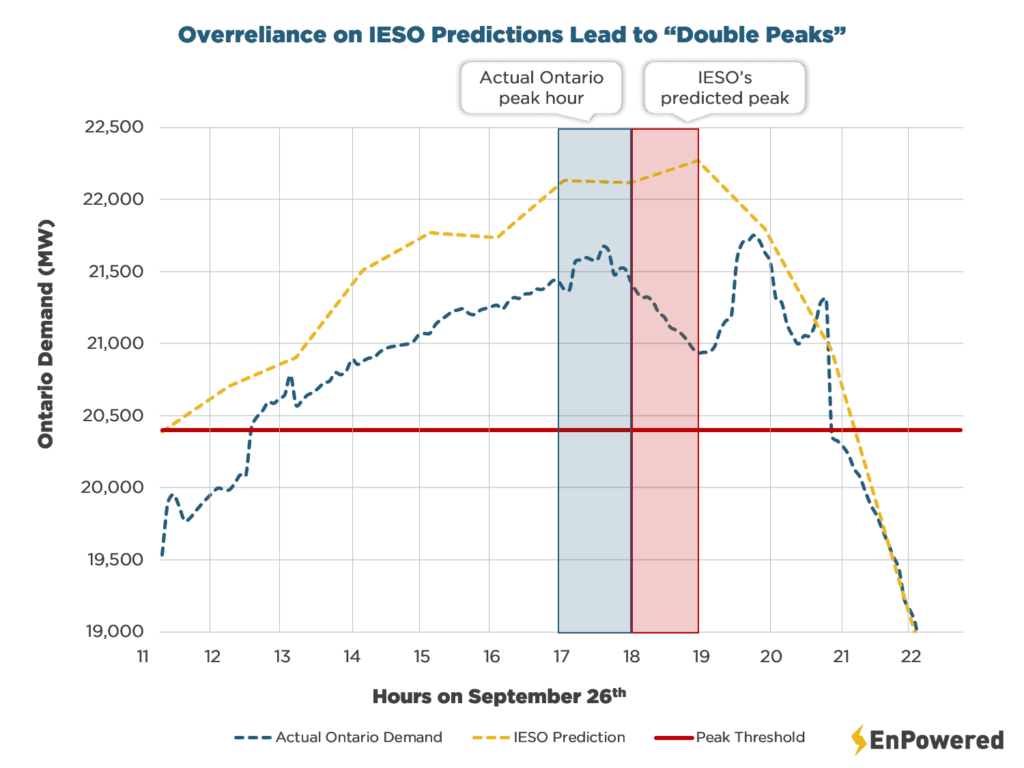
Double Peaks have also become quite common during summer days, as on September 26th, 2017. This usually occurs during extreme weather events, when every Global Adjustment Class A customer can be confident that the day will become a peak day. The problem then arises in predicting precisely which hour will be the peak hour.
Most Class A businesses continue to rely on the publicly available IESO predictions to estimate when the peak hour will occur. This can create select, but impactful, issues. For example, on September 26th the IESO predicted that the peak hour would occur between 6pm and 7pm.
This consequently caused many businesses to reduce their usage from 6pm to 7pm to catch the peak hour. This dramatically decreased usage and contributed to two so-called Double Peaks, which occurred from 5pm to 6pm, and from 7pm to 8pm.
As a result, many of the businesses that relied on the IESO data unfortunately missed the peak hour, and therefore earned no savings in the ICI Program.
In response to this inaccurate data, some businesses moved to shut-down production for much longer periods of time. For example, some may decide to shut down from 4 to 9pm. However, this causes enormous disruptions to their production and can be extremely costly.
The new phenomenon, that is beginning to occur, is that the greater the projected peak usage, the more likely it is that Global Adjustment Class A customers will respond. As a result, with a greater response from the market, it becomes more likely that the peak will not actually occur as originally predicted.
Clearly, a different solution is needed. Relying on just publicly-available information from the IESO and basic spreadsheet models that are run off the same information is not sufficient.
Given the phenomenon described above, a complex algorithm becomes necessary.
An algorithm that will not only estimate what the Province’s electricity usage will be, but will also account for how the market will respond. This model would then enable a user to avoid False Peak days, and accurately predict which hour will be the true peak hour. There is a solution that may be able to achieve this and is described in further detail in the next section.
Complexity of Demand Prediction
Naturally, demand response is not the only factor affecting the pattern of energy demand in the Province of Ontario. There are also baseline factors that have always occurred in the market. With extreme weather conditions, either extremely hot or cold, energy usage spikes as residents and businesses alike attempt to control the temperature in their buildings.
There are also fairly reliable and consistent energy usage patterns that occur between 4pm and 8pm in the summer, and between 5pm and 7pm in the winter.
These are strongly correlated with when homeowners are returning home each day. A single individual coming home at a consistent time and turning on their heating, lights, and home appliances is obviously not enough to affect the provincial energy demand; millions of individuals all living on roughly the same schedule can cause major changes in energy usage on the provincial scale.
Most Class A customers have a system in place to reduce their usage during peak hours. Some businesses simply turn off their lights, while others opt to completely shut-down during peak hours. Each strategy comes with its own set of advantages and disadvantages, especially since strategies can affect production schedules, be labour-intensive, prohibitively expensive, or some combination of the above.
The majority of Class A customers hire external energy consultants to predict the energy market to help shift electricity usage during peak hours. Many of these so-called experts simply use the publicly available IESO data, an approach is riddled with the issues as mentioned above.
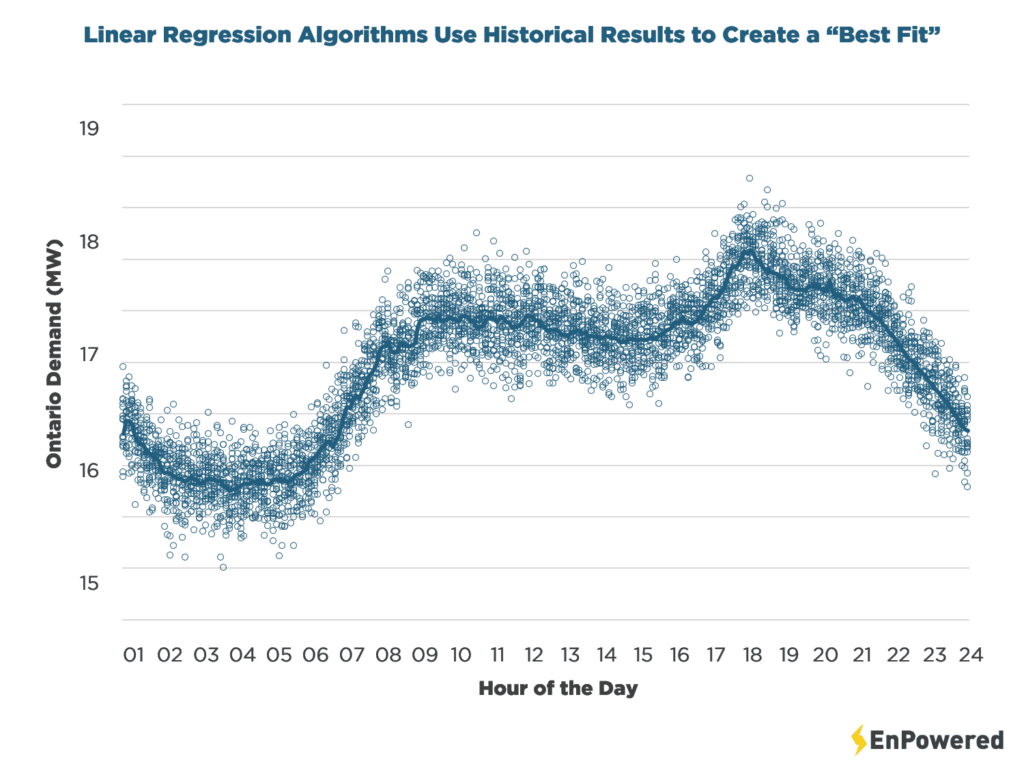
There are some experts who will go a bit further. These experts will usually attempt to tackle these issues by using a statistical data analysis approach called linear regression which analyzes and models a relationship between the scalar dependent and one or more independent variables.
What this means is that given a number of points of data, these consultants will try to essentially “connect the dots,” and based on this effort, predict the placement of future points. Through the use of this model, linear regression analyses can be used to fit simple predictive models. Unfortunately, these models are designed for simple predictions.
The prediction of energy usage in the Province of Ontario, which relies on hundreds of different variables, is most certainly not a simple prediction.
When considering simple sets of variables and only a few influencing factors, linear regression analyses are indeed highly effective at displaying trends.
However, in order to forecast energy demand accurately, the model must, at a minimum, consider the following influencing factors:
- Air Temperature
- Wind Speed
- Dew Point
- Humidity
- Probability of Precipitation Forecasts
- Human Behaviour
- Response Fluctuations
- ….and many other factors.
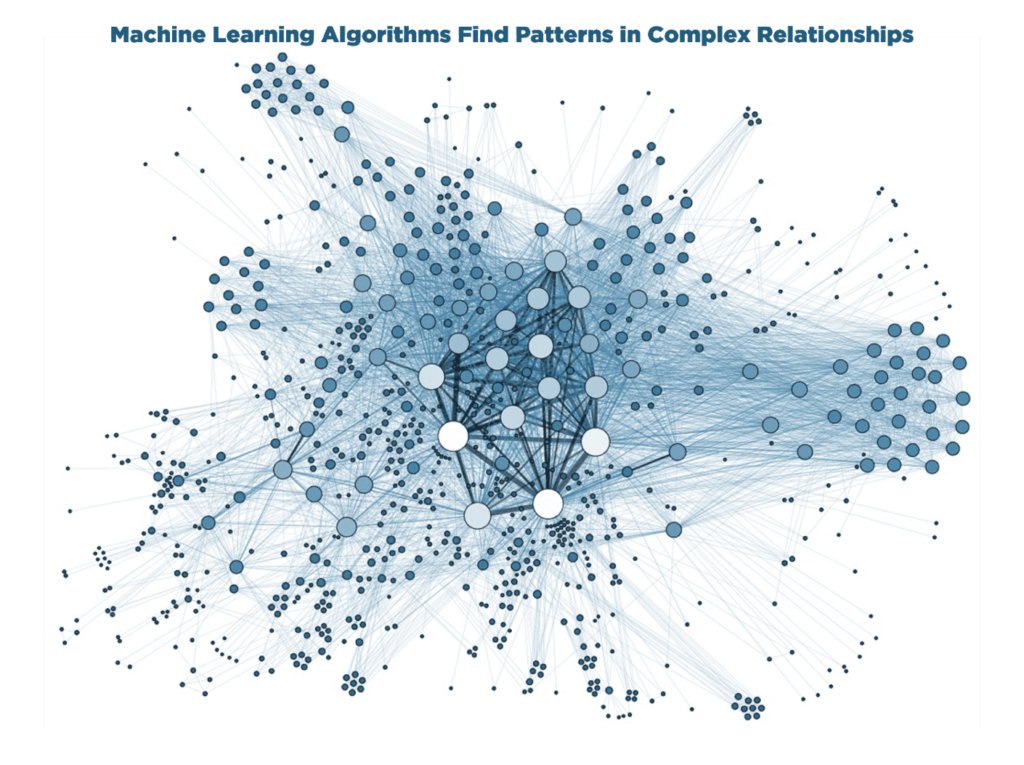
Exacerbating the problem further is that all of these factors interact with one another, and therefore the complexity of these relationships increases exponentially.
This means that even if one were to account for every factor that affects the energy demand in the Province of Ontario, they would still need to consider how human behaviour influences the energy response fluctuations as one example, or how air temperature changes human behaviour.
The result is that models built using linear regression algorithms are simply unable to accurately predict Ontario’s electricity demand; especially as it becomes more important to not only predict the base electricity usage, but also to predict how other market participants will respond during potential peak days.
Thankfully, a better option exists, which is described in more detail in the next section.

Related Resources