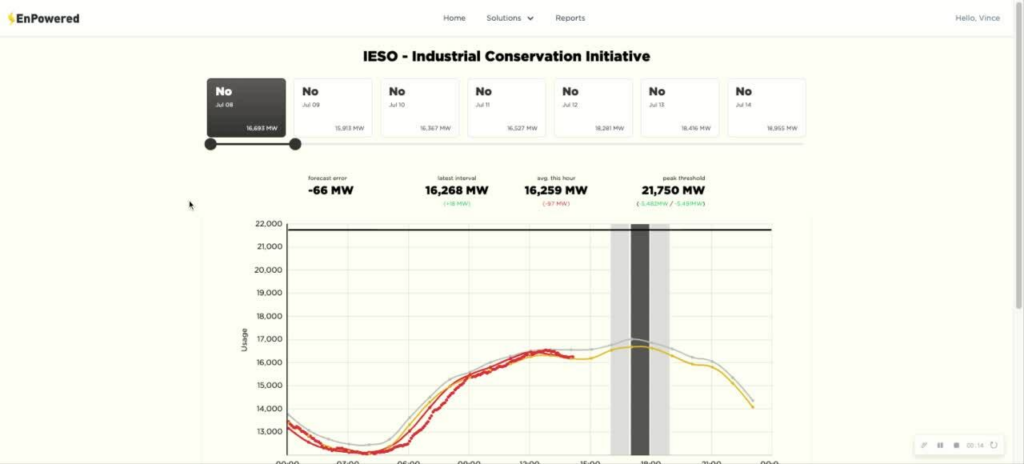
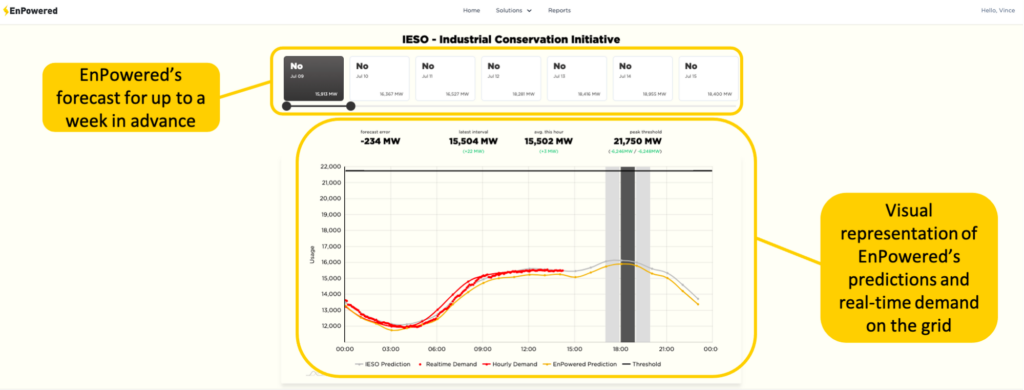
To display the peak forecast for the current day, and up to a week in advance, navigate to the ‘Solutions’ tab at the top of the portal and select your region from the dropdown menu. This will bring you to the peak forecast dashboard. Here you will see seven horizontal boxes along the top of your dashboard. Each will display the date and one of the following: “No”, “Maybe”, or “Yes.”
A “No” indicates that there is no chance of a peak event being called on that day. Generally, in this case the threshold for a peak event has not been met, or other variables indicate that there is no chance a peak will be called.
A “Maybe” indicates that there is a chance a peak event might be called on that day. In this case, the peak threshold may have been met, or is close to being met. It is recommended that the portal user(s) remain cognizant of the portal forecasts, text, and email notifications from EnPowered, to ensure they are informed about the situation.
A “Yes” indicates that a peak will be called on that day. In this case, it is highly recommended that user(s) pay close attention to the notifications sent out by EnPowered, for more information regarding the peak hour and window.
Below the day/week forecast you will see the grid demand and forecast graph. This is where you can visualize the real-time energy demand on the grid, the regional system operator’s and EnPowered’s peak predictions. You can use the thin black vertical line below the date boxes to expand upon and visualize the system operator and EnPowered’s peak forecasts for multiple days into the future.
Related Resources