To view the IESO 5-Minute Demand Reports, navigate to the ‘Solutions’ tab at the top of the portal and select ‘IESO – Industrial Conservation Initiative’ from the dropdown menu. This will bring you to the peak forecast dashboard. If you scroll down to the bottom of the page, below the predictions graph, you will see the reports.
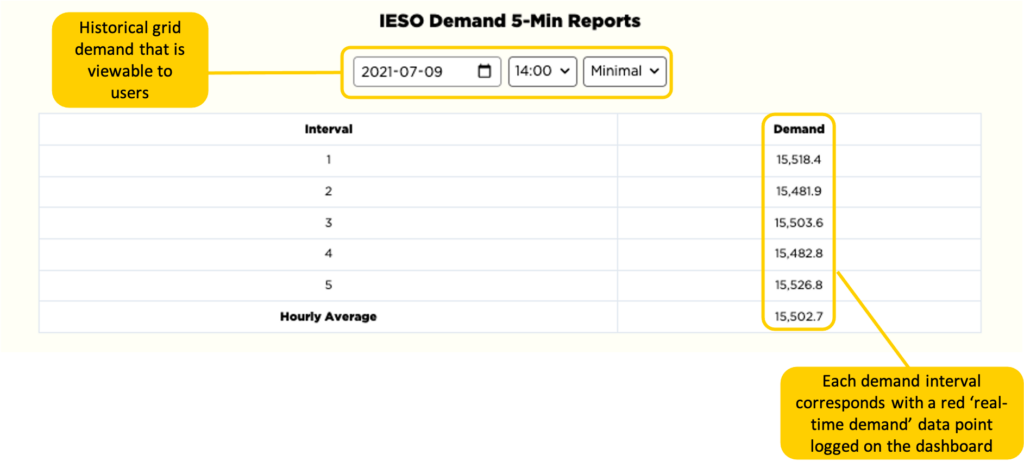
Here you will find the historical grid demand in five-minute intervals. Each of these demand intervals correspond with a red ‘real-time demand’ data point logged on the predictions graph above. You have the ability to sort through historical data if you wish to find information on the grid demand during specific days and hours.
Watch the ‘5-Min Demand Report’ tutorial here.
Related Resources