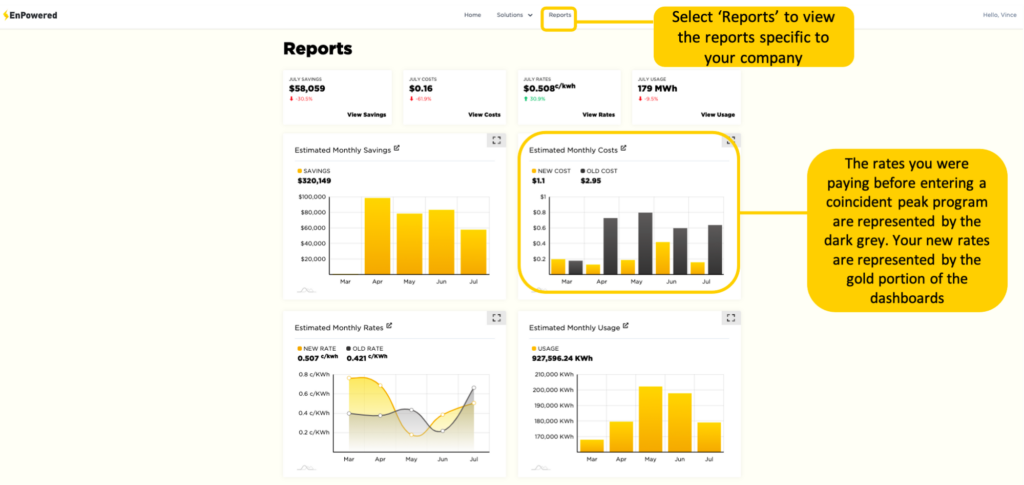
To view the reports specific to your company, navigate to the ‘Reports’ tab at the top of the portal. This will bring you to the reports dashboard where you will see your estimated monthly savings, estimated monthly costs, estimated monthly rates, and estimated monthly usage.
Here you will see multiple dashboards representing your pre-program and post-program costs, savings, rates, and usage. Your rates and the amount that you were paying before entering a coincident peak program are represented by the dark gray portions of the dashboards. Your new rates and the amount that you are now saving by participating in a coincident peak program, is represented by the gold portion of the dashboards.
Watch the ‘dashboard reports’ tutorial here.
Related Resources